6 Standard Setting
The standard setting process for the Dynamic Learning Maps® (DLM®) Alternate Assessment System in English language arts (ELA) and mathematics was originally conducted following the 2014–2015 administration. Four performance level descriptors (PLDs) were developed to describe performance on the assessment. A 4-day standard setting meeting specified cut points and included a follow-up evaluation of impact data and cut points. Because of blueprint revisions adopted beginning in 2019–2020 (see Chapter 2), the original cut points were adjusted in spring 2022. Adjustment occurred in spring 2022 rather than 2020 due to COVID-19 affecting both the 2020 and 2021 administrations.
This chapter provides a brief description of the development of the rationale for the standard setting approach; the policy PLDs; methods, preparation, procedures, and results of the original standard setting meeting and follow-up evaluation of the impact data and cut points; specification of grade- and subject-specific PLDs, which were developed after approval of the consortium cuts; and methods, preparation, procedures, and results from the adjustment to the cut points in 2022, including updated grade- and subject-specific PLDs. A more detailed description of the original DLM standard setting activities and results can be found in the 2015 Year-End Model Standard Setting: English Language Arts and Mathematics Technical Report (Karvonen, Clark, et al., 2015) and in the corresponding peer-reviewed academic journal article (Clark et al., 2017).
6.1 Original Standard Setting Process
The 2014–2015 school year was the first fully operational testing year for the DLM assessments in ELA and mathematics. The operational testing window ended on June 12, 2015, and DLM staff conducted standard setting during June 15–18, 2015, in Kansas City, Missouri. The standard setting event included all states administering DLM assessments in 2014–2015 with the purpose of establishing a set of cut points for each of the two testing models. The DLM Technical Advisory Committee (TAC) advised on the standard setting methodology from early design through to the development of grade- and subject-specific PLDs and review of impact data after the event. Although the DLM Governance Board voted on acceptance of final cut points, individual states had the option to adopt the consortium cut points or develop their own independent cut points.
6.1.1 Standard Setting Approach: Rationale and Overview
The approach to standard setting was developed to be consistent with the DLM Alternate Assessment System’s design and to rely on established methods, such as recommended practices for developing, implementing, evaluating, and documenting standard settings (Cizek, 1996; Hambleton et al., 2012) and the Standards on Educational and Psychological Testing (American Educational Research Association et al., 2014). The DLM standard setting approach used DLM mastery classifications and drew from several established methods, including generalized holistic (Cizek & Bunch, 2006) and body of work (Kingston & Tiemann, 2012).
Because the DLM assessments are based on large, fine-grained learning maps and make use of diagnostic classification modeling rather than traditional psychometric methods, the standard setting approach relied on the aggregation of dichotomous classifications of linkage level mastery for each Essential Element (EE) in the blueprint. Drawing from the generalized holistic and body of work methods, the standard setting method used a profile approach to classify student mastery of linkage levels into performance levels (see Clark et al., 2017). Profiles provided a holistic view of student performance by summarizing across the EEs and linkage levels. Cut points were determined by evaluating the total number of mastered linkage levels. Although the number of mastered linkage levels is not an interval scale, the process for identifying the DLM cut points is roughly analogous to assigning a cut point along a scale score continuum.
Before making a final decision whether to use the profile approach, the DLM TAC reviewed a preliminary description of the proposed methods. At the TAC’s suggestion, DLM staff conducted a mock panel process using this profile-based approach to evaluate the feasibility of the rating task and the likelihood of obtaining sound judgments using this method. Figure 6.1 summarizes the complete set of sequential steps included in the DLM standard setting process. This includes steps conducted before, during, and after the on-site meeting during June 2015.
Figure 6.1: Steps of the DLM Standard Setting Process
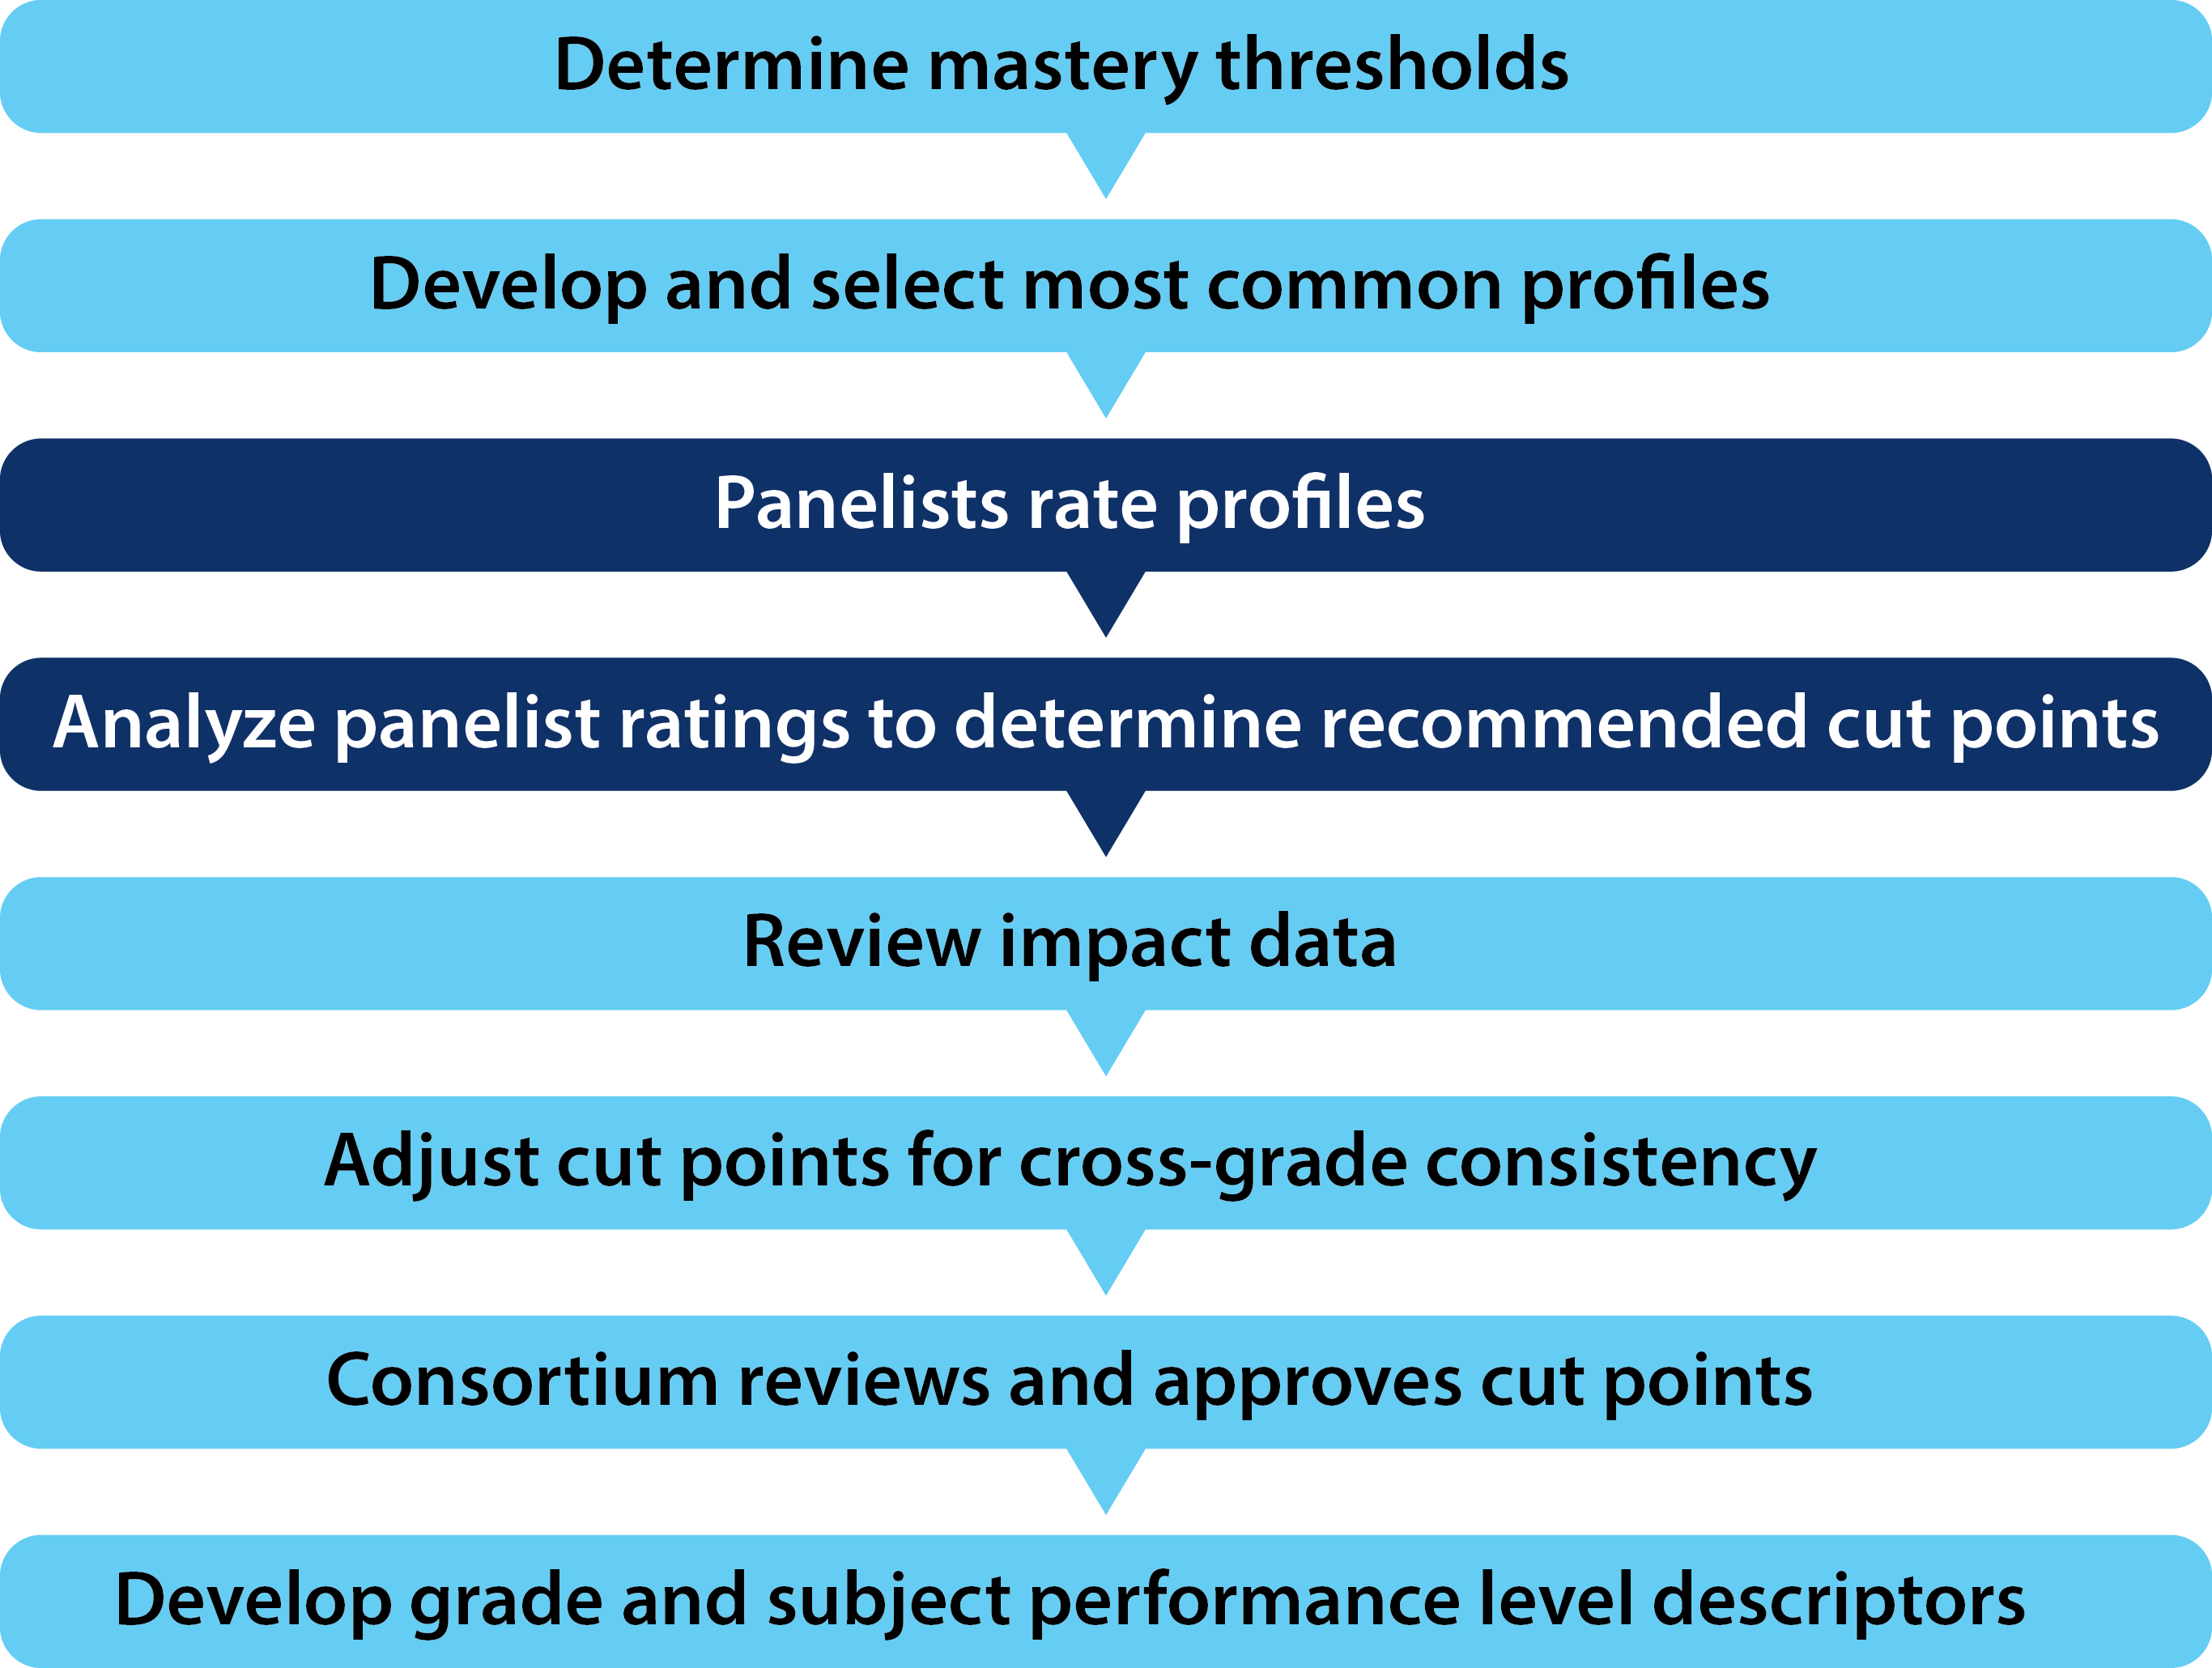
Note. Dark shading represents steps conducted at the standard setting meeting in June 2015.
6.1.2 Policy Performance Level Descriptors
Student results are reported as performance levels, and PLDs are used to inform the interpretation of those scores. The DLM Governance Board developed PLDs through a series of discussions and draft PLD reviews between July and December 2014. Discussion began at the July 2014 governance meeting with governance board members in attendance who had special education and assessment backgrounds. As part of the discussion, the group reviewed the language used in the general education consortia and in the Common Core State Standards for key features describing performance. Following the meeting, governance board members took draft PLDs back to their states and were responsible for collecting feedback at the state and local level according to their own state policies and practices for stakeholder involvement. Table 6.1 presents the final version of policy PLDs. The consortium-level definition of proficiency was at target. Policy PLDs served as anchors for panelists during the standard setting process.
| Performance level descriptors |
|---|
| The student demonstrates emerging understanding of and ability to apply content knowledge and skills represented by the Essential Elements. |
| The student’s understanding of and ability to apply targeted content knowledge and skills represented by the Essential Elements is approaching the target. |
| The student’s understanding of and ability to apply content knowledge and skills represented by the Essential Elements is at target. |
| The student demonstrates advanced understanding of and ability to apply targeted content knowledge and skills represented by the Essential Elements. |
6.1.3 Profile Development
Prior to the standard setting meeting, DLM staff generated profiles of student learning that summarized linkage level mastery for each assessed EE. First, for each EE and linkage level that was assessed, we calculated the students’ probability of mastery using the diagnostic classification model (see Chapter 5 of this manual). For each linkage level, all students with a probability greater than or equal to .8 received a linkage level mastery status of 1, or mastered. All students with a probability lower than .8 received a linkage level mastery status of 0, or not mastered. Maximum uncertainty occurs when the probability is .5 and maximum certainty when the probability approaches 0 or 1. Considering the risk of false positives and negatives, the threshold used to determine mastery classification was set at .8.
The threshold value was applied to student assessment data to create profiles of student mastery, which summarize linkage level mastery by EE. Profiles were created using data for each subject and grade. Each profile listed all the linkage levels for all the EEs from the blueprint, along with the conceptual area for each EE, with shaded boxes indicating the mastered linkage levels. Figure 6.2 provides an example profile for a hypothetical student.
Figure 6.2: Example Standard Setting Profile for a Hypothetical Student
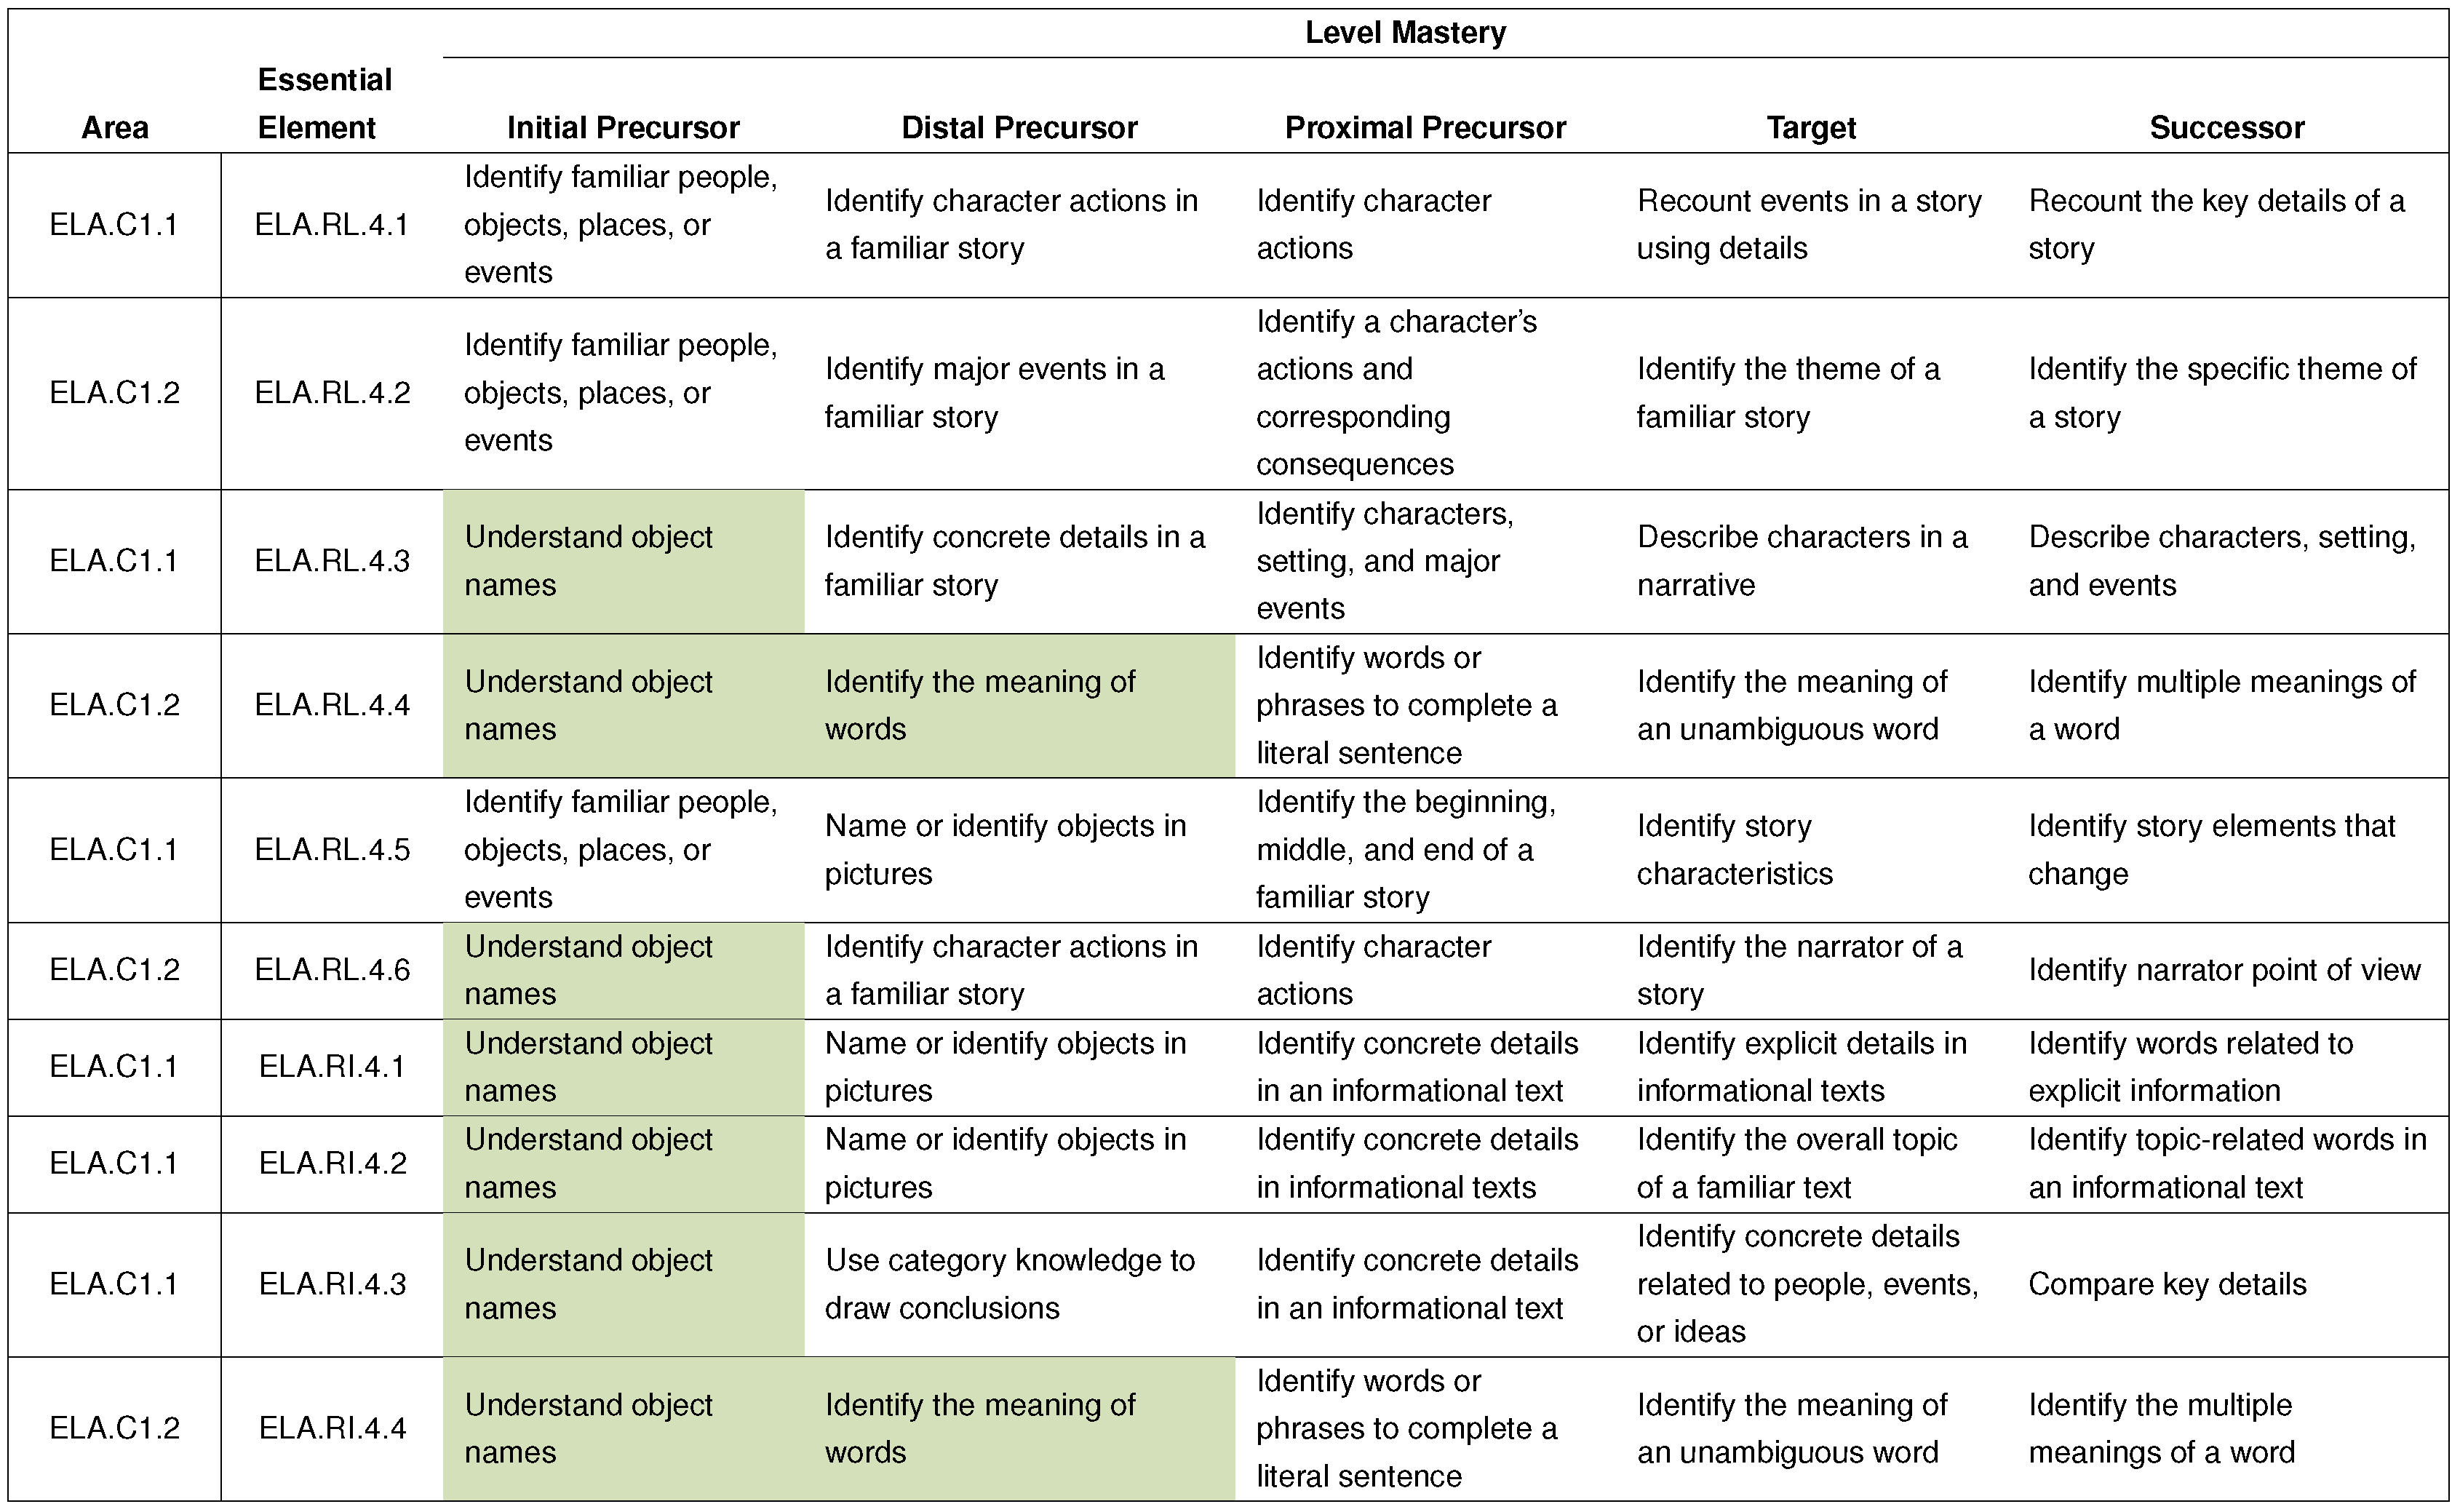
Note. Green shading represents linkage level mastery.
Profiles were available for all students who participated in the spring assessment window by May 15, 2015 (n = 49,958). The frequency with which each precise profile (i.e., pattern of linkage level mastery) occurred in this population was computed. Based on these results, the three most common profiles were selected for each possible total linkage level mastery value (i.e., total number of linkage levels mastered) for each grade and subject. In instances in which data were not available at a specific linkage level value (e.g., no students mastered exactly 47 linkage levels for a grade and subject), profiles were based on simulated data. To simulate profiles, the DLM test development teams used adjacent profiles for reference and created simulated profiles that represented likely patterns of mastery. Fewer than 10% of all the profiles developed were simulated. Further detail on specific procedures for preparing standard setting profiles may be found in Chapter 1 of the 2015 Year-End Model Standard Setting: English Language Arts and Mathematics Technical Report (Karvonen, Clark, et al., 2015).
6.1.4 Panelists
DLM staff worked with participating states in March 2015 to recruit standard setting panelists. States were responsible for communicating within their state to recruit potential panelists. Panelists sought were those with both content knowledge and expertise in the education and outcomes of students with the most significant cognitive disabilities, including educators and school and district administrators. Other subject matter experts, such as higher education institution faculty or state and regional educational staff, were also suggested for consideration. Employers were considered at the high school level only, specifically targeting companies that employ individuals with disabilities.
The 46 panelists who participated in standard setting represented varying backgrounds. Table 6.2 and Table 6.3 summarize their demographic information. Most of the selected panelists were classroom educators. Panelists had a range of years of experience with ELA, mathematics, and working with students with the most significant cognitive disabilities.
Half of the participants had experience with setting standards for other assessments (n = 23). Some panelists already had experience with the DLM assessment, either from writing items (n = 4) or externally reviewing items and testlets (n = 18). Only two panelists reported having less than 1 year or no experience with alternate assessments; both were classroom educators with at least 13 years of experience working with students with the most significant cognitive disabilities. Further detail on standard setting volunteers, selection process, and panel composition may be found in Chapter 3 of the 2015 Year-End Model Standard Setting: English Language Arts and Mathematics Technical Report (Karvonen, Clark, et al., 2015).
| Demographic subgroup | n |
|---|---|
| Gender | |
| Female | 42 |
| Male | 4 |
| Race | |
| White | 35 |
| African American | 5 |
| Asian | 2 |
| Not disclosed | 2 |
| American Indian/Alaska Native | 1 |
| Hispanic/Latino | 1 |
| Native Hawaiian/Pacific Islander | 0 |
| Professional role | |
| Classroom educator | 32 |
| District staff | 6 |
| Other | 6 |
| Building administrator | 2 |
| University faculty/staff | 0 |
| Experience type | Average | Minimum | Maximum |
|---|---|---|---|
| English language arts | 15.8 | 0 | 50 |
| Mathematics | 15.9 | 0 | 49 |
| Students with significant cognitive disabilities | 15.1 | 1 | 36 |
6.1.5 Meeting Procedures
Panelists participated in a profile-based standard setting procedure to make decisions about cut points. The panelists participated in four rounds of activities in which they moved from general to precise recommendations about cut points.
The primary tools of this procedure were range-finding folders and pinpointing folders. The range-finding folders contained profiles of student work that represented the scale range. Pinpointing folders contained profiles for specific areas of the range.
Throughout the procedure, DLM staff instructed panelists to use their best professional judgment and consider all students with the most significant cognitive disabilities to determine which performance level best described each profile. Each panel had at least two, and up to three, grade-level cut points to set.
The subsequent sections provide details of the final procedures, including quality assurance used for determining cut points. Further information regarding all meeting procedures and fidelity of the final procedures to the planned procedures may be found in Chapter 4 and the appendix of the 2015 Year-End Model Standard Setting: English Language Arts and Mathematics Technical Report (Karvonen, Clark, et al., 2015).
6.1.5.1 Training
Panelists were provided with training both before and during the standard setting workshop. Advance training was available online, on demand, in the 10 days prior to the standard setting workshop. The advance training addressed the following topics:
- Students who take the DLM assessments
- Content of the assessment system, including DLM learning maps, EEs, claims and conceptual areas, linkage levels, and alignment
- Accessibility by design, including the framework for the DLM System’s cognitive taxonomy and strategies for maximizing accessibility of the content; the use of the Personal Needs and Preferences Profile to provide accessibility supports during the assessment; and the use of the First Contact survey to determine linkage level assignment
- Assessment design, including item types, testlet design, and sample items from various linkage levels in both subjects
- An overview of the assessment model, including test blueprints and the timing and selection of testlets administered
- A high-level introduction to two topics that would be covered in more detail during on-site training: the DLM approach to scoring and reporting and the steps in the standard setting process
Additional panelist training was conducted at the standard setting workshop. The purposes of on-site training were twofold: (1) to review advance training concepts that panelists had indicated less comfort with and (2) to complete a practice activity to prepare panelists for their responsibilities during the panel meeting. The practice activity consisted of range finding using training profiles for just a few total linkage levels mastered (e.g., 5, 10, 15, 20). Overall, panelists participated in approximately 8 hours of standard setting training before beginning the practice activity.
6.1.5.2 Range Finding
During the range-finding process, panelists reviewed a limited set of profiles to assign general divisions between the performance levels using a two-round process. The goal of range finding was to locate ranges (in terms of number of linkage levels mastered) in which panelists agreed that approximate cut points should exist.
First, panelists independently evaluated profiles and identified the performance level that best described each profile. Once all panelists completed their ratings, the facilitator obtained the performance level recommendations for each profile by a raise of hands.
After a table discussion of how panelists chose their ratings, the panelists were given the opportunity to adjust their independent ratings if they chose. A second round of ratings were recorded and shared with the group.
Using the second round of ratings, built-in logistic regression functions were used to calculate the probability of a profile being categorized in each performance level, conditioned on the number of linkage levels mastered, and the most likely cut points for each performance level were identified. In instances in which the logistic regression function could not identify a value (i.e., the group unanimously agreed on the categorization of profiles to performance levels, so there was no variance in the ratings to fit a logistic regression), the approximate cut point was determined as the midway point between the unanimous profiles. For example, if all profiles with 10 linkage levels mastered were unanimously rated as the Emerging performance level, and all profiles with 15 linkage levels mastered were unanimously rated as the Approaching the Target performance level, the approximate cut point was set at 13. Chapter 4 of the 2015 Year-End Model Standard Setting: English Language Arts and Mathematics Technical Report (Karvonen, Clark, et al., 2015) provides greater detail on range finding and pinpointing and includes the number of linkage levels per grade and subject.
6.1.5.3 Pinpointing
Pinpointing rounds followed range finding. During pinpointing, panelists reviewed additional profiles to refine the cut points. The goal of pinpointing was to pare down to specific cut points in terms of the number of linkage levels mastered within the general ranges determined in range finding, while not relying on conjunctive or compensatory judgments.
First, panelists reviewed profiles for the seven linkage levels including and around the cut point value identified during range finding. Next, panelists independently evaluated the leveled profiles and assigned each a performance level—those in the higher level and those in the lower level. Once all panelists completed their ratings, the facilitator obtained the recommendations for each profile by a raise of hands.
After discussion of the ratings, a second round of ratings commenced. Panelists were given the opportunity to adjust their independent ratings if they chose. Using the second round of ratings, built-in logistic regression functions were used to calculate the probability of a profile being categorized in each performance level, conditioned on the number of linkage levels mastered, and the most likely cut points for each performance level were identified. In instances in which the logistic regression function could not identify a value (e.g., the group unanimously agreed on the categorization of profiles to performance levels), psychometricians evaluated the results to determine the final recommended cut point based on panelist recommendations. Chapter 4 of the 2015 Year-End Model Standard Setting: English Language Arts and Mathematics Technical Report (Karvonen, Clark, et al., 2015) provides greater detail on range finding and pinpointing and includes the number of linkage levels per grade and subject.
6.1.5.4 Panelist Evaluations and Panel-Recommended Cut Points
Across all cut points (N = 414), panelists indicated they were comfortable with the group-recommended cut point in 94.0% of cases. Table 6.4 provides the panelist comfort rating of group-recommended cut points. Only 6.0% of responses (n = 25) indicated a discomfort with a group-recommended cut point. For 9 out of 18 cut point panels (50.0%; i.e., one panel for each grade and subject), panelists indicated comfort with all three recommended cut points. Most recommendations for a change to the cut point were for only one of the three cut points for a given panel, and most often, the recommended changes differed from the initial recommendation by only a single linkage level. Chapter 5 of the 2015 Year-End Model Standard Setting: English Language Arts and Mathematics Technical Report (Karvonen, Clark, et al., 2015) provides greater detail on final independent evaluations of panel-recommended cut points.
| Subject | N Panelists | N Ratings (n panelists \(\times\) n cut points evaluated) | ``Yes’’ ratings | % Agreement |
|---|---|---|---|---|
| English language arts | 24 | 216 | 206 | 95 |
| Mathematics | 22 | 198 | 183 | 92 |
6.1.6 Smoothing the Cut Points
To mitigate the effect of sampling error and issues related to a system of cut points across a series of grade levels, adjustments were made to the panel-recommended cut points in an effort to systematically smooth distributions within the system of cut points being considered. The specific steps applied to each subject within each grade level can be found in the 2015 Year-End Model Standard Setting: English Language Arts and Mathematics Technical Report (Karvonen, Clark, et al., 2015). The goal of the smoothing process was to have a more consistent percentage of students in each performance level and across grade levels within each subject. The smoothing process followed these steps:
- For each grade and subject, calculate the cumulative percentage of students at each number of total linkage levels mastered.
- Perform a probit transformation to convert each cumulative percentage to a z-score.
- Find the z-score associated with each of the panel-recommended cut points.
- For each z-score identified in Step 3, calculate a new weighted z-score by assigning 0.5 weight to the current z-score, and 0.25 weight to each adjacent grade. For Grades 3 and 11, which had only one adjacent grade, 0.667 weight was given to the current grade, and 0.333 weight was given to the adjacent grade. For example, when calculating the weighted z-score for the Grade 4 cut point between the Emerging and Approaching performance levels, 0.5 weight would be given to the z-score for the Grade 4 Emerging/Approaching cut point, 0.25 weight would be given to the z-score for the Grade 3 Emerging/Approaching cut point, and 0.25 weight would be given to the z-score for the Grade 5 Emerging/Approaching cut point.
- For each grade and subject, the total linkage levels mastered associated with the z-score closest to the weighted average for each cut point is the smoothed cut point.
For a complete description of the smoothing process, see the 2015 Year-End Model Standard Setting: English Language Arts and Mathematics Technical Report (Karvonen, Clark, et al., 2015).
6.1.7 Results
This section summarizes the panel-recommended and smoothed cut points and presents impact data for the final cut points. Additional detailed results are provided in Chapter 5 of the 2015 Year-End Model Standard Setting: English Language Arts and Mathematics Technical Report (Karvonen, Clark, et al., 2015).
6.1.7.1 Panel Recommended and Smoothed Cut Points
Table 6.5 displays the cut point recommendations reached by the panelists following the range-finding and pinpointing process.
| Grade | Emerging/ Approaching | Approaching/ Target | Target/ Advanced | Total linkage levels possible |
|---|---|---|---|---|
| English language arts | ||||
| 3 | 40 | 55 | 73 | 80 |
| 4 | 35 | 55 | 74 | 85 |
| 5 | 43 | 59 | 79 | 85 |
| 6 | 19 | 41 | 63 | 80 |
| 7 | 23 | 48 | 67 | 90 |
| 8 | 26 | 51 | 69 | 85 |
| 9 | 19 | 50 | 72 | 85 |
| 10 | 15 | 47 | 73 | 85 |
| 11 | 23 | 48 | 69 | 85 |
| Mathematics | ||||
| 3 | 15 | 24 | 42 | 55 |
| 4 | 19 | 29 | 50 | 80 |
| 5 | 13 | 30 | 39 | 75 |
| 6 | 16 | 26 | 42 | 55 |
| 7 | 18 | 41 | 51 | 70 |
| 8 | 22 | 37 | 53 | 70 |
| 9 | 9 | 26 | 34 | 40 |
| 10 | 6 | 16 | 37 | 45 |
| 11 | 13 | 24 | 39 | 45 |
As described in section 6.1.6, a smoothing procedure was applied to the panel-recommended cut points to mitigate the effect of sampling error and issues related to a system of cut points across a series of grade levels. Table 6.6 shows the smoothed cut points that were derived from the methods described above.
| Grade | Emerging/ Approaching | Approaching/ Target | Target/ Advanced | Total linkage levels possible |
|---|---|---|---|---|
| English language arts | ||||
| 3 | 36 | 50 | 71 | 80 |
| 4 | 38 | 57 | 75 | 85 |
| 5 | 35 | 53 | 76 | 85 |
| 6 | 27 | 46 | 65 | 80 |
| 7 | 27 | 52 | 73 | 90 |
| 8 | 23 | 48 | 72 | 85 |
| 9 | 20 | 48 | 68 | 85 |
| 10 | 17 | 47 | 72 | 85 |
| 11 | 18 | 47 | 70 | 85 |
| Mathematics | ||||
| 3 | 12 | 21 | 37 | 55 |
| 4 | 20 | 30 | 56 | 80 |
| 5 | 15 | 32 | 48 | 75 |
| 6 | 13 | 28 | 38 | 55 |
| 7 | 19 | 37 | 53 | 70 |
| 8 | 17 | 40 | 53 | 70 |
| 9 | 10 | 21 | 33 | 40 |
| 10 | 8 | 21 | 36 | 45 |
| 11 | 8 | 18 | 38 | 45 |
6.1.7.2 Final Impact Data
Figure 6.3 and Figure 6.4 display the results of the smoothed cut points in terms of impact for ELA and mathematics, respectively. Chapter 5 of the 2015 Year-End Model Standard Setting: English Language Arts and Mathematics Technical Report (Karvonen, Clark, et al., 2015) reports the frequency distributions for the panel-recommended cut points. Table 6.7 includes the demographic data for students included in the impact data.
Figure 6.3: English Language Arts Impact Data Using Smoothed Cut Points
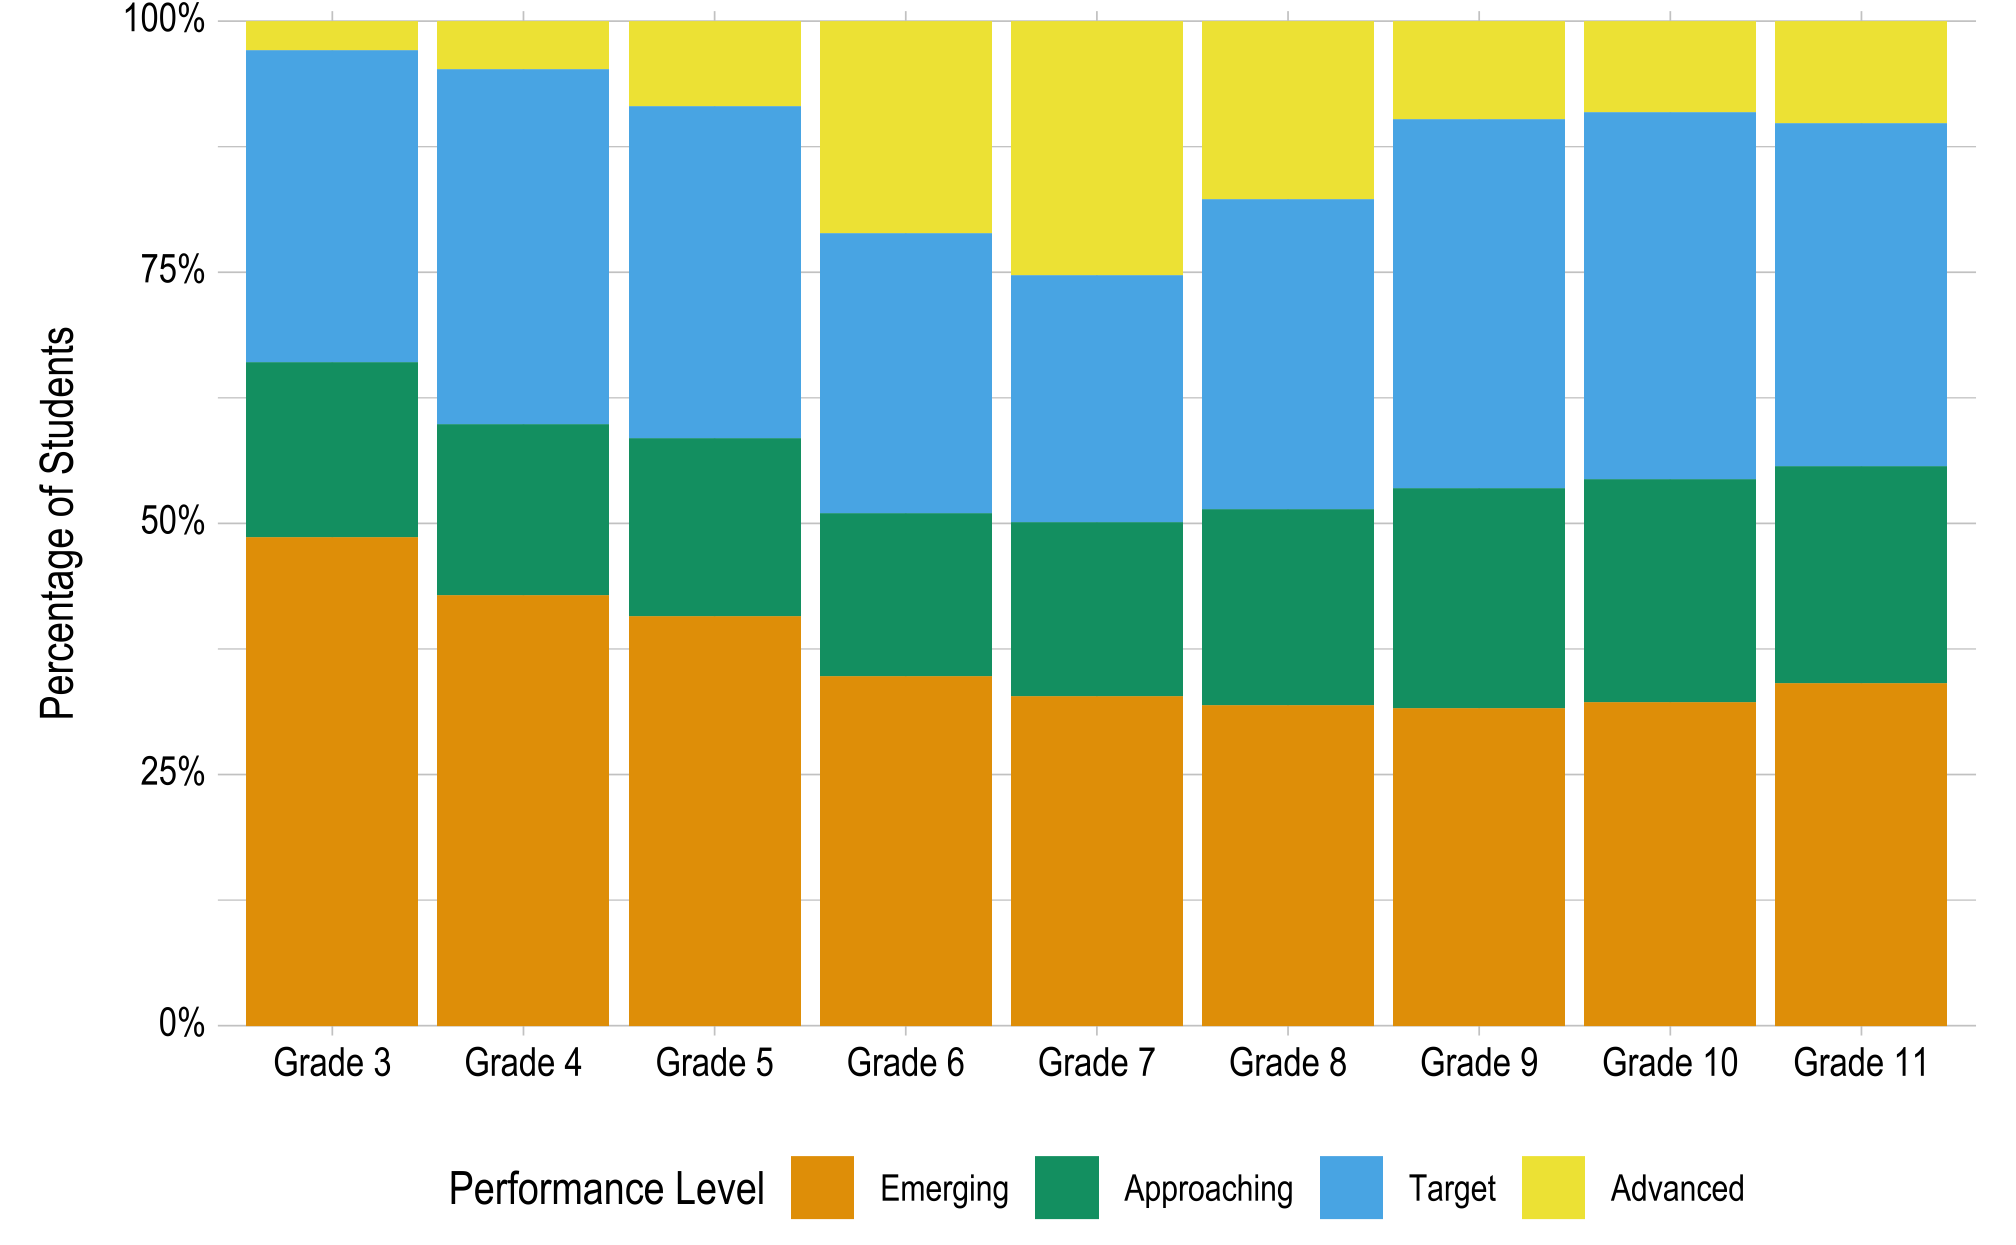
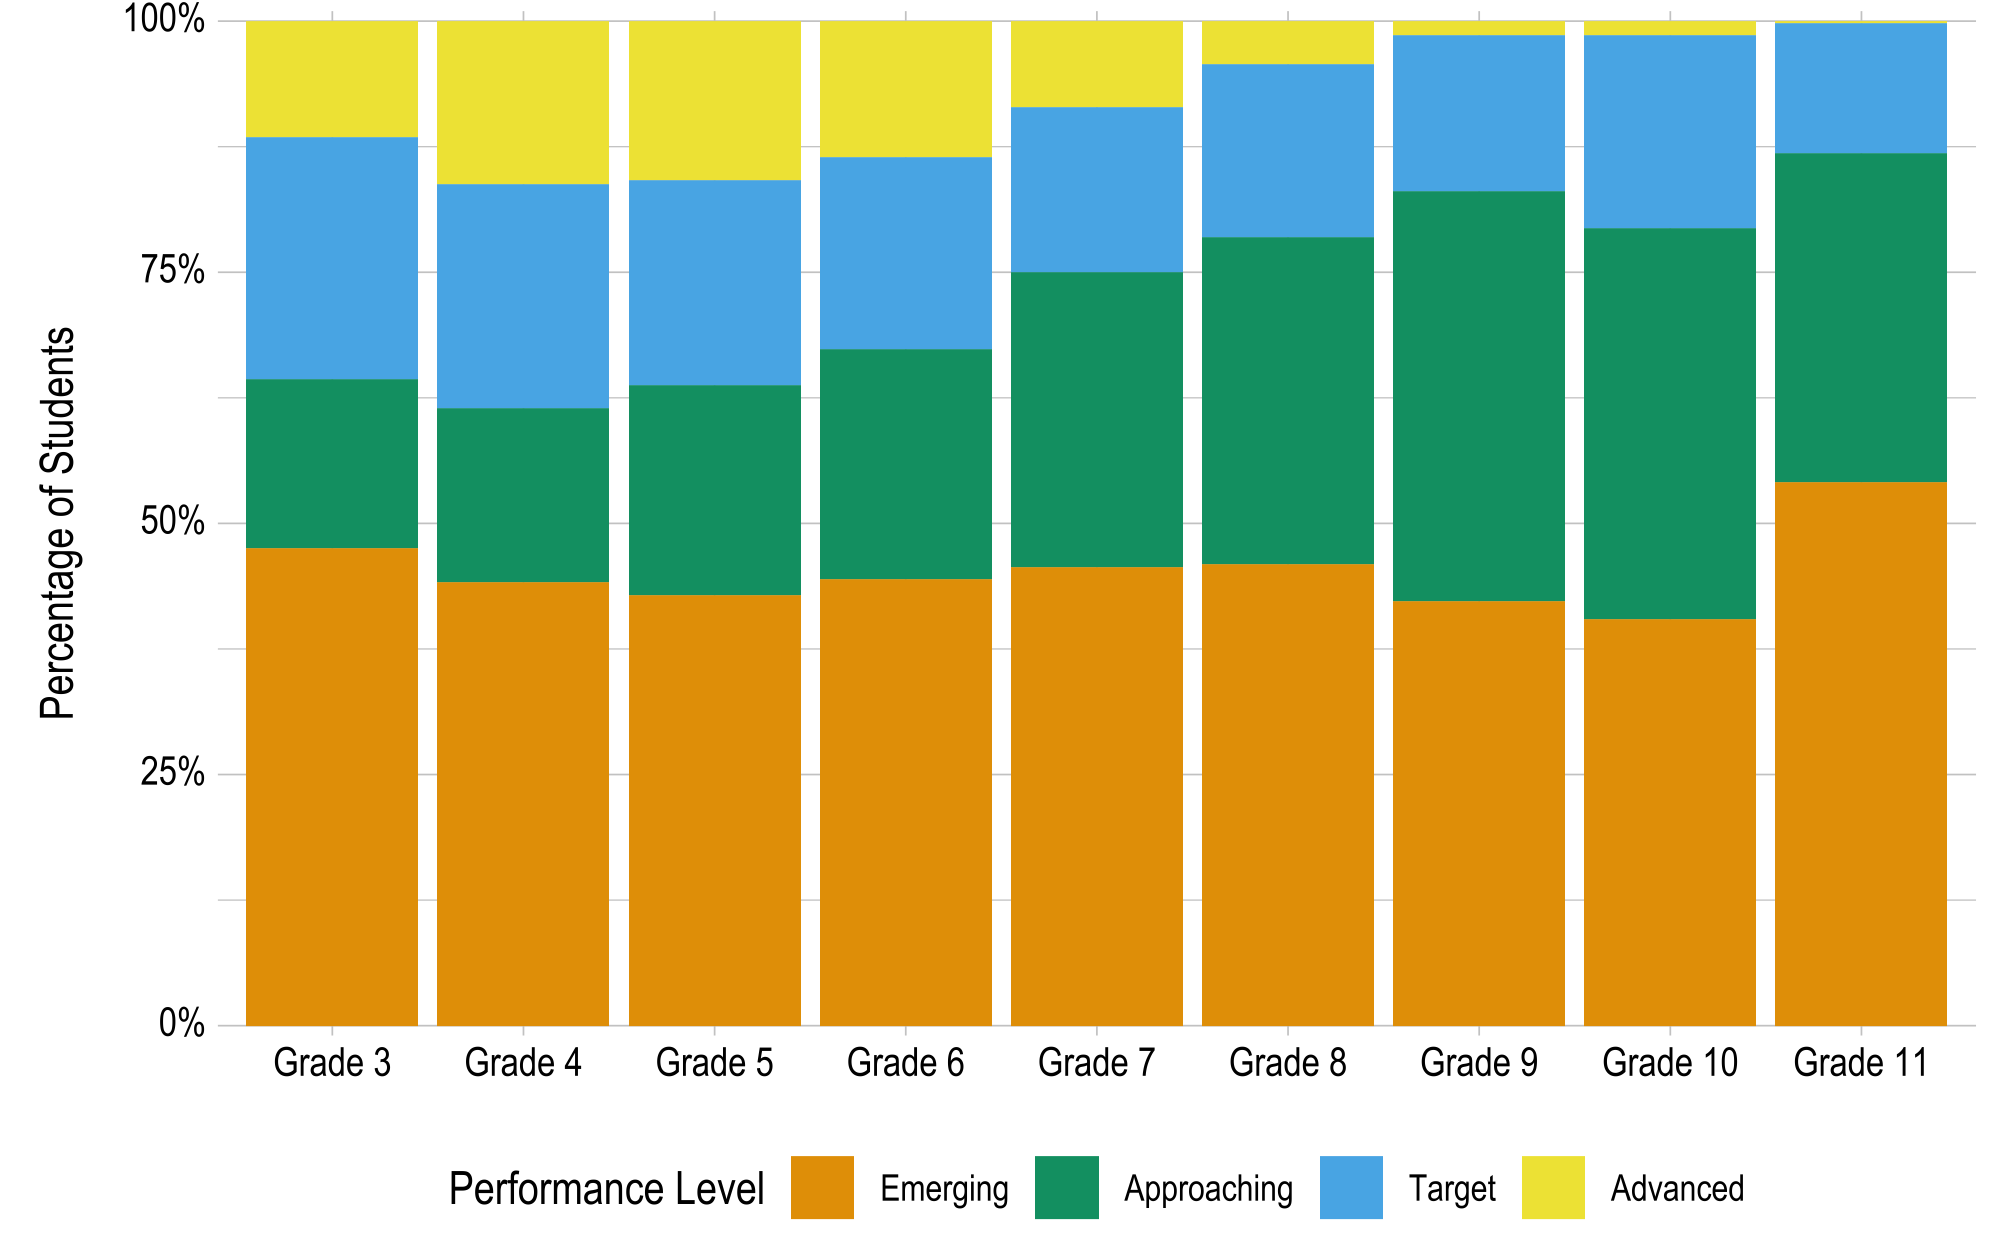
Figure 6.4: Mathematics Impact Data Using Smoothed Cut Points
| Subgroup | n | % |
|---|---|---|
| Gender | ||
| Male | 35,132 | 64.8 |
| Female | 18,068 | 33.3 |
| Missing† | 1,004 | 1.9 |
| Primary disability | ||
| Intellectual disability | 6,250 | 11.5 |
| Autism | 5,097 | 9.4 |
| Other health impairment | 4,526 | 8.3 |
| Multiple disabilities | 1,455 | 2.7 |
| Specific learning disability | 637 | 1.2 |
| Other | 2,429 | 4.5 |
| Missing† | 33,810 | 62.4 |
| Race | ||
| White | 28,459 | 52.5 |
| African American | 9,309 | 17.2 |
| Two or more races | 6,741 | 12.4 |
| American Indian | 3,723 | 6.9 |
| Asian | 1,645 | 3.0 |
| Native Hawaiian/Pacific Islander | 388 | 0.7 |
| Alaska Native | 244 | 0.5 |
| Missing† | 3,695 | 6.8 |
| Hispanic ethnicity | ||
| Non-Hispanic | 22,776 | 42.0 |
| Hispanic | 4,790 | 8.8 |
| Missing† | 26,638 | 49.1 |
| English learning (EL) participation | ||
| Not EL eligible or monitored | 51,547 | 95.1 |
| EL eligible or monitored | 2,630 | 4.9 |
| Missing† | 27 | <0.1 |
| English language arts complexity band | ||
| Foundational | 9,306 | 17.2 |
| Band 1 | 15,324 | 28.3 |
| Band 2 | 19,636 | 36.2 |
| Band 3 | 9,937 | 18.3 |
| Missing | 1 | <0.1 |
| Mathematics complexity band | ||
| Foundational | 10,282 | 19.0 |
| Band 1 | 16,433 | 30.3 |
| Band 2 | 20,398 | 37.6 |
| Band 3 | 7,089 | 13.1 |
| Missing | 2 | <0.1 |
| † Demographic variables were not required in 2014–2015. | ||
6.1.8 External Evaluation of Standard Setting Process and Results
The DLM TAC chair was on-site for the duration of the standard setting event and reported that the standard setting meeting was well planned and implemented, the staff were helpful to the panelists, and the panelists worked hard to set standards. The full TAC accepted a resolution about the adequacy, quality of judgments, and extent to which the process met professional standards. The TAC chair memorandum and TAC resolution are provided in Appendix L of the 2015 Year-End Model Standard Setting: English Language Arts and Mathematics Technical Report (Karvonen, Clark, et al., 2015).
The panel-recommended cut points, adjusted cut points, and associated impact data for both sets of cut points were presented to the TAC and governance board for review. The TAC supported the DLM smoothing method and resulting adjusted cut points. Following the states’ review process and discussion with DLM staff, the DLM Governance Board voted to accept the DLM-recommended smoothed cut points as the final consortium cut points with no further adjustment.
6.1.9 Grade Level and Subject Performance Level Descriptors
Based on the general approach to standard setting, which relied on mastery profiles to anchor panelists’ content-based judgments, grade- and subject-specific PLDs were not used during standard setting. Instead, they emerged based on the final cut points and example profiles, and they were syntheses of content from the more fine-grained linkage level descriptors. Grade- and subject-specific PLDs were completed after standard setting in 2015.
Standard setting panelists began the process by drafting lists of skills and understandings that they determined were characteristic of specific performance levels after cut points had been established. In general, these draft lists of skills and understandings were based on linkage levels described in the mastery profiles used for standard setting—either separate linkage level statements or syntheses of multiple statements.
These draft lists of important skills were collected and used as a starting point for DLM test development teams as they developed language for grade- and subject-specific descriptions for each performance level in every grade for both ELA and mathematics. The purpose of these content descriptions was to provide information about the knowledge and skills that are typical for each performance level.
Test development teams prepared to draft PLDs by consulting published research related to PLD development (e.g., Perie, 2008) and reviewing PLDs developed for other assessment systems to consider grain size of descriptive language and formats for publication. In addition to the draft lists generated by standard setting panelists, test development teams used the following materials as they drafted specific language for each grade- and subject-specific PLD:
- DLM assessment blueprints
- Cut points set at standard setting for each grade and subject
- Sample mastery profiles from the standard setting event
- Essential Element Concept Maps for each EE included on the blueprint for each grade level
- Linkage level descriptions and associated sections of the DLM learning maps for every EE
- The Standards of Mathematical Practice
Test development teams reviewed the EEs, Essential Element Concept Maps, and linkage level descriptors on the profiles to determine skills and understandings assessed at the grade level. These skills and understandings come from each conceptual area assessed at the specific grade level and vary from one grade to the next. Then, the teams reviewed the draft skill lists created by standard setting panelists and final cut points approved by the consortium. Test development teams then used the sample mastery profiles to consider the types and ranges of student performances that could lead to placement into specific performance levels. Using these multiple sources of information, the test development teams evaluated the placement of skills into each of the four performance levels.
While not an exhaustive list of all the content related to each EE from the DLM learning maps, the synthesis of standard setting panelist judgments and test development team judgments provided the basis for descriptions of the typical performance of students showing mastery at each performance level. As test development teams drafted PLDs for each grade, they reviewed the descriptors in relation to each other and the underlying DLM learning map to ensure that there was differentiation in skills from one grade to the next. In very few cases, in which panelists recommended skill placement that was inconsistent with development of content knowledge as represented in the DLM maps, test development teams adjusted the placement of skills. This was only done in cases in which the original judgment of the panelists was inconsistent with a logical ordering of skill development from one level to the next in a particular grade.
DLM staff prepared initial drafts of the grade- and subject-specific descriptions for Grade 3. Project staff reviewed these drafts internally. Additional drafts were prepared for Grades 4 and 5. The DLM Governance Board reviewed a combination of Grades 3, 4, and 5 at the December 2015 consortium governance meeting. Project staff asked the governance board to review the progression of descriptors from grade to grade within the four performance levels in Grades 3, 4, and 5 and to provide general feedback to the initial drafts. Feedback from the governance board focused on utility for educators and parents and structuring the descriptions to make them more user-friendly. The primary responses to governance board feedback were to:
- Review technical language in existing drafts and simplify wherever possible.
- Organize each grade and subject-specific description so that a broad conceptual statement about what students at a performance level typically knew and were able to do was followed by specific skills and understandings shown in bulleted lists.
- Organize descriptions consistently within and across grades so that related skills were described in the same sequence within each level in a grade.
DLM staff delivered drafts of all grade- and subject-specific descriptions to the governance board for review in February 2016. After the review period ended, test development teams responded to feedback received by adjusting technical descriptions, removing any content that exceeded the requirements of EEs in the grade level, simplifying language, and clarifying descriptions of skills and understandings. These adjustments were followed by a full editorial review.
6.2 Standards Adjustment
In 2019–2020, Year-End model states adopted revised assessment blueprints in ELA and mathematics (see Chapter 2 of this manual for a description of the blueprint revisions). In short, the blueprint revisions reduced the total number of EEs that were assessed in each grade, which also reduced the total number of linkage levels available to be mastered. Because the original standard setting process resulted in cut points that were applied to the total number of linkage levels mastered in the subject, changing the number of linkage levels available required an adjustment to the original cut points set in 2015.
6.2.1 Adjustment Procedures
When the blueprint revisions were adopted, the governance board, in consultation with the TAC, opted for a statistical adjustment to the existing cut points rather than conducting a full standard setting. The statistical adjustment consisted of two steps:
- Reduce each cut point in proportion to the number of EEs that were removed from the blueprint in each grade and subject.
- Adjust the proportionally reduced cut points ±2 using impact data from spring 2020 (after implementing the revised blueprints) to preserve the reported performance level distributions that were reported in 2018–2019.
As described in Chapter 2, the blueprint revision process was designed to keep the construct constant. Thus, performance level distributions should also be constant. The ±2 adjustment accounts for potential differences in EEs that were removed from or retained on the blueprint (e.g., difficulty, reliability) to preserve the performance level distributions.
Due to the cancellation of assessment in spring 2020 and continued disruptions in 2021 (Accessible Teaching, Learning, and Assessment Systems, 2021) resulting from the COVID-19 pandemic, on advice of the TAC, the second step of the adjustment process was postponed until spring 2022. In May 2022, DLM staff collected all data for students who completed their assessment by May 6, 2022. Using the May 6 sample, we calculated the total linkage levels mastered for each student in each subject. The DLM staff then applied the proportionally reduced cut points from step 1 to calculate the percentage of students within each performance level. These percentages were compared to the corresponding percentages that were reported in 2018–2019, and the cut points were adjusted ±2 to make the 2022 percentages from the May 6 sample be more consistent with the 2018–2019 percentages.
6.2.2 Sample Representativeness
In consultation with the TAC, thresholds for proceeding with the adjustment process were put in place to ensure that the sample of students who completed their assessments by May 6, 2022, was representative of the full DLM student population. First, DLM staff set minimum sample size thresholds to ensure a sufficient number of students in each grade and subject and to get a reliable estimate of the percentage of students in each performance level. Specifically, DLM staff determined that the number of students with a completed assessment in each grade and subject by May 6, 2022, must be at least 20% of the total number of students who completed assessments during spring 2019 (the most recent year in which participation was not affected by the COVID-19 pandemic).
Additionally, DLM staff required that at least 11 of the 14 Year-End model states be represented in each grade or high school grade band. Table 6.8 shows the minimum sample size threshold and the observed number of completed assessments by May 6, 2022. Overall, the number of students who completed assessments by May 6, 2022, was well above the minimum thresholds. All 14 participating states were represented in all grades or grade bands, and in total, the students with completed assessments represented approximately 70% of all students from Year-End states who were enrolled in the DLM assessment system for 2022.
| Grade | N (2019) | Minimum N (2022) | Observed N (2022) | Observed states |
|---|---|---|---|---|
| English language arts | ||||
| 3 | 8,777 | 1,756 | 7,754 | 14 |
| 4 | 9,518 | 1,904 | 8,070 | 14 |
| 5 | 9,525 | 1,905 | 8,103 | 14 |
| 6 | 9,559 | 1,912 | 8,169 | 14 |
| 7 | 9,555 | 1,911 | 8,341 | 14 |
| 8 | 9,432 | 1,887 | 8,535 | 14 |
| 9 | 6,739 | 1,348 | 4,081 | 14* |
| 10 | 3,454 | 691 | 2,613 | 14* |
| 11 | 6,137 | 1,228 | 6,529 | 14* |
| Mathematics | ||||
| 3 | 8,763 | 1,753 | 7,757 | 14 |
| 4 | 9,503 | 1,901 | 8,082 | 14 |
| 5 | 9,526 | 1,906 | 8,165 | 14 |
| 6 | 9,551 | 1,911 | 8,639 | 14 |
| 7 | 9,544 | 1,909 | 8,796 | 14 |
| 8 | 9,426 | 1,886 | 8,702 | 14 |
| 9 | 6,736 | 1,348 | 4,303 | 14* |
| 10 | 3,451 | 691 | 2,646 | 14* |
| 11 | 6,143 | 1,229 | 7,008 | 14* |
| * State participation in grades 9–12 was grade banded to account for differences in high school testing requirements across states. | ||||
In addition to the overall size of the sample, we also put in place a representativeness threshold for proceeding. The representativeness threshold was designed to ensure that the students included in the May 6 sample were not systematically different from those students who completed their assessments later in the testing window. Using the May 6 sample, DLM staff calculated the percentage of students in each demographic subgroup for each grade and subject (i.e., gender, race, Hispanic ethnicity, English language learner status, and complexity band).
The DLM staff then calculated the percentage of students from the full sample of students enrolled in the system, regardless of completion status, in each of the same subgroups and calculated the Cramér’s (1946) V effect size for the differences in distribution of each demographic group across samples (e.g., the distribution of race should be consistent across the May 6 and enrolled student population samples). Cramér’s V is based on the chi-squared test of association and can be interpreted using the guidelines suggested by Cohen (1988).
To proceed, we required that all effect sizes must be in the negligible range (i.e., less than 0.2 using Cohen’s guidelines). Table 6.9 shows the effect sizes for each grade and demographic variable for ELA and mathematics. Across both subjects, the largest effect size was 0.06, which was well below the threshold of 0.2. Thus, the sample of students who completed their assessment by May 6, 2022, was demographically consistent with the full sample of students enrolled in the system.
| Grade | Gender | Race | Hispanic ethnicity | English language learner status | Complexity band |
|---|---|---|---|---|---|
| English language arts | |||||
| 3 | .008 | .020 | .014 | .016 | .029 |
| 4 | .008 | .025 | .012 | .031 | .036 |
| 5 | .006 | .027 | .002 | .023 | .040 |
| 6 | .003 | .020 | .014 | .027 | .041 |
| 7 | .008 | .026 | .001 | .026 | .042 |
| 8 | .005 | .022 | .011 | .026 | .036 |
| 9 | .016 | .039 | .019 | .057 | .034 |
| 10 | .005 | .013 | < .001 | .010 | .031 |
| 11 | .008 | .020 | .006 | .008 | .027 |
| Mathematics | |||||
| 3 | .007 | .021 | .010 | .017 | .046 |
| 4 | .007 | .024 | .010 | .034 | .044 |
| 5 | .003 | .027 | < .001 | .023 | .050 |
| 6 | .003 | .017 | .009 | .023 | .043 |
| 7 | .007 | .022 | .006 | .027 | .039 |
| 8 | .008 | .021 | .013 | .025 | .044 |
| 9 | .016 | .034 | .005 | .061 | .047 |
| 10 | .006 | .014 | < .001 | .012 | .030 |
| 11 | .003 | .017 | .009 | .007 | .031 |
6.2.3 Results
In this section, the proportionally reduced and adjusted cut points, as well as impact data, are summarized.
6.2.3.1 Proportionally Reduced and Adjusted Cut Points
Table 6.10 shows the proportionally reduced cut points that result from reducing each cut point in Table 6.6 in proportion to the number of EEs removed from the assessment blueprint.
| Grade | Emerging/ Approaching | Approaching/ Target | Target/ Advanced | Total linkage levels possible |
|---|---|---|---|---|
| English language arts | ||||
| 3 | 22 | 31 | 44 | 50 |
| 4 | 25 | 37 | 49 | 55 |
| 5 | 21 | 31 | 45 | 50 |
| 6 | 19 | 32 | 45 | 55 |
| 7 | 20 | 38 | 53 | 65 |
| 8 | 18 | 37 | 55 | 65 |
| 9 | 16 | 40 | 56 | 70 |
| 10 | 14 | 39 | 59 | 70 |
| 11 | 15 | 39 | 58 | 70 |
| Mathematics | ||||
| 3 | 9 | 15 | 27 | 40 |
| 4 | 10 | 15 | 28 | 40 |
| 5 | 8 | 17 | 26 | 40 |
| 6 | 8 | 18 | 24 | 35 |
| 7 | 10 | 18 | 26 | 35 |
| 8 | 10 | 23 | 30 | 40 |
| 9 | 9 | 18 | 29 | 35 |
| 10 | 7 | 19 | 32 | 40 |
| 11 | 5 | 12 | 25 | 30 |
As described in section 6.2.1, an adjustment procedure was applied to the proportionally reduced cut points to preserve the reported performance level distributions that were reported in 2018–2019. Table 6.11 shows the final cut points derived from the adjustment process.
| Grade | Emerging/ Approaching | Approaching/ Target | Target/ Advanced | Total linkage levels possible |
|---|---|---|---|---|
| English language arts | ||||
| 3 | 22 | 31 | 44 | 50 |
| 4 | 23 | 37 | 49 | 55 |
| 5 | 21 | 33 | 45 | 50 |
| 6 | 21 | 33 | 45 | 55 |
| 7 | 18 | 37 | 53 | 65 |
| 8 | 18 | 35 | 54 | 65 |
| 9 | 17 | 39 | 55 | 70 |
| 10 | 15 | 38 | 59 | 70 |
| 11 | 15 | 39 | 58 | 70 |
| Mathematics | ||||
| 3 | 9 | 15 | 27 | 40 |
| 4 | 10 | 17 | 30 | 40 |
| 5 | 10 | 17 | 25 | 40 |
| 6 | 8 | 18 | 24 | 35 |
| 7 | 9 | 19 | 26 | 35 |
| 8 | 9 | 23 | 30 | 40 |
| 9 | 7 | 20 | 27 | 35 |
| 10 | 8 | 19 | 32 | 40 |
| 11 | 6 | 14 | 25 | 30 |
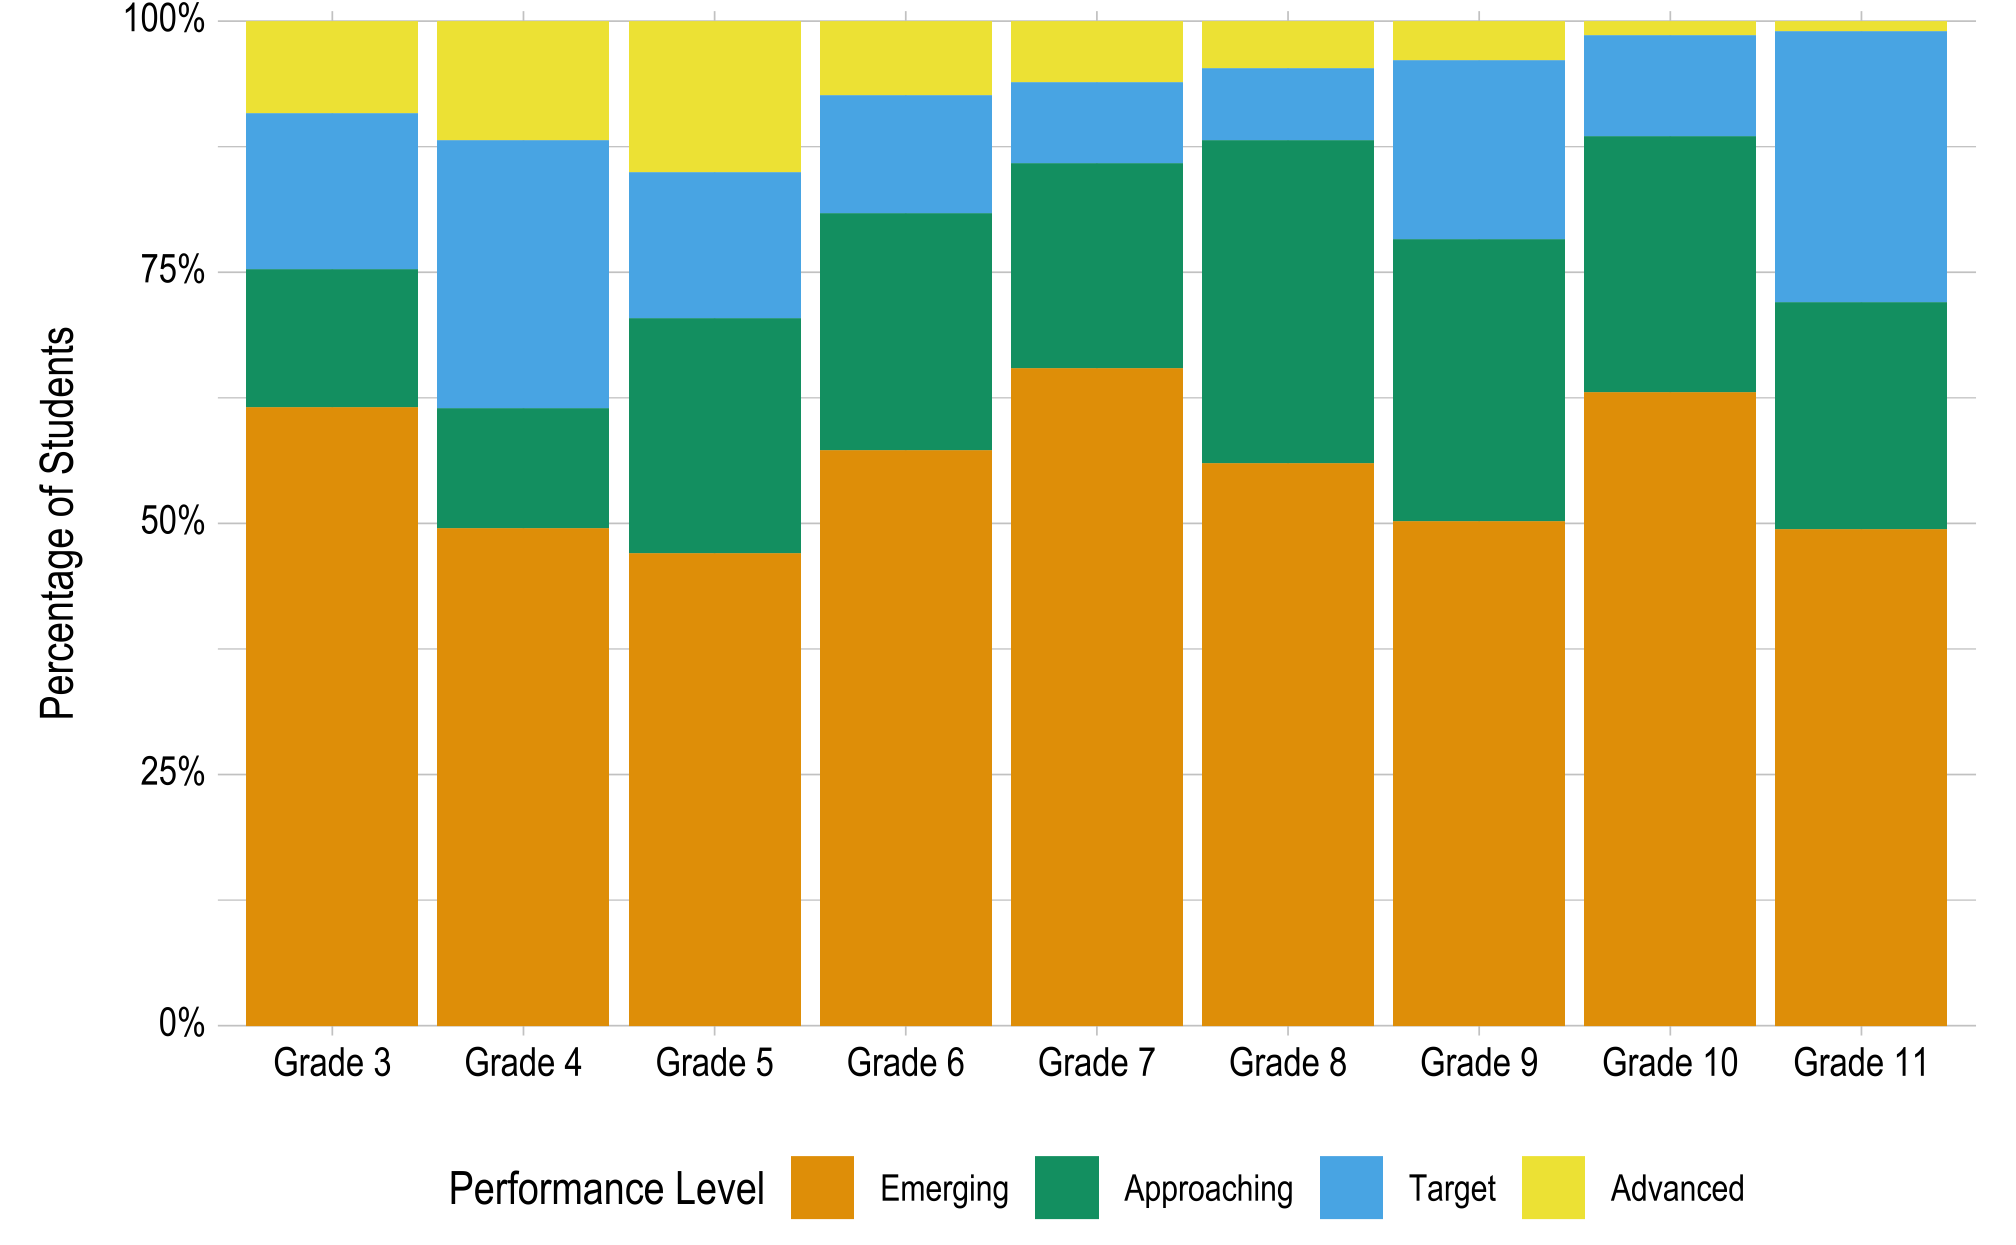
6.2.3.2 Final Impact Data
Figure 6.5 and Figure 6.6 display the results of the adjusted cut points in terms of impact for ELA and mathematics, respectively. Table 6.12 includes the demographic data for students included in the impact data (i.e., the May 6 sample).
Figure 6.5: English Language Arts Impact Data Using Adjusted Cut Points
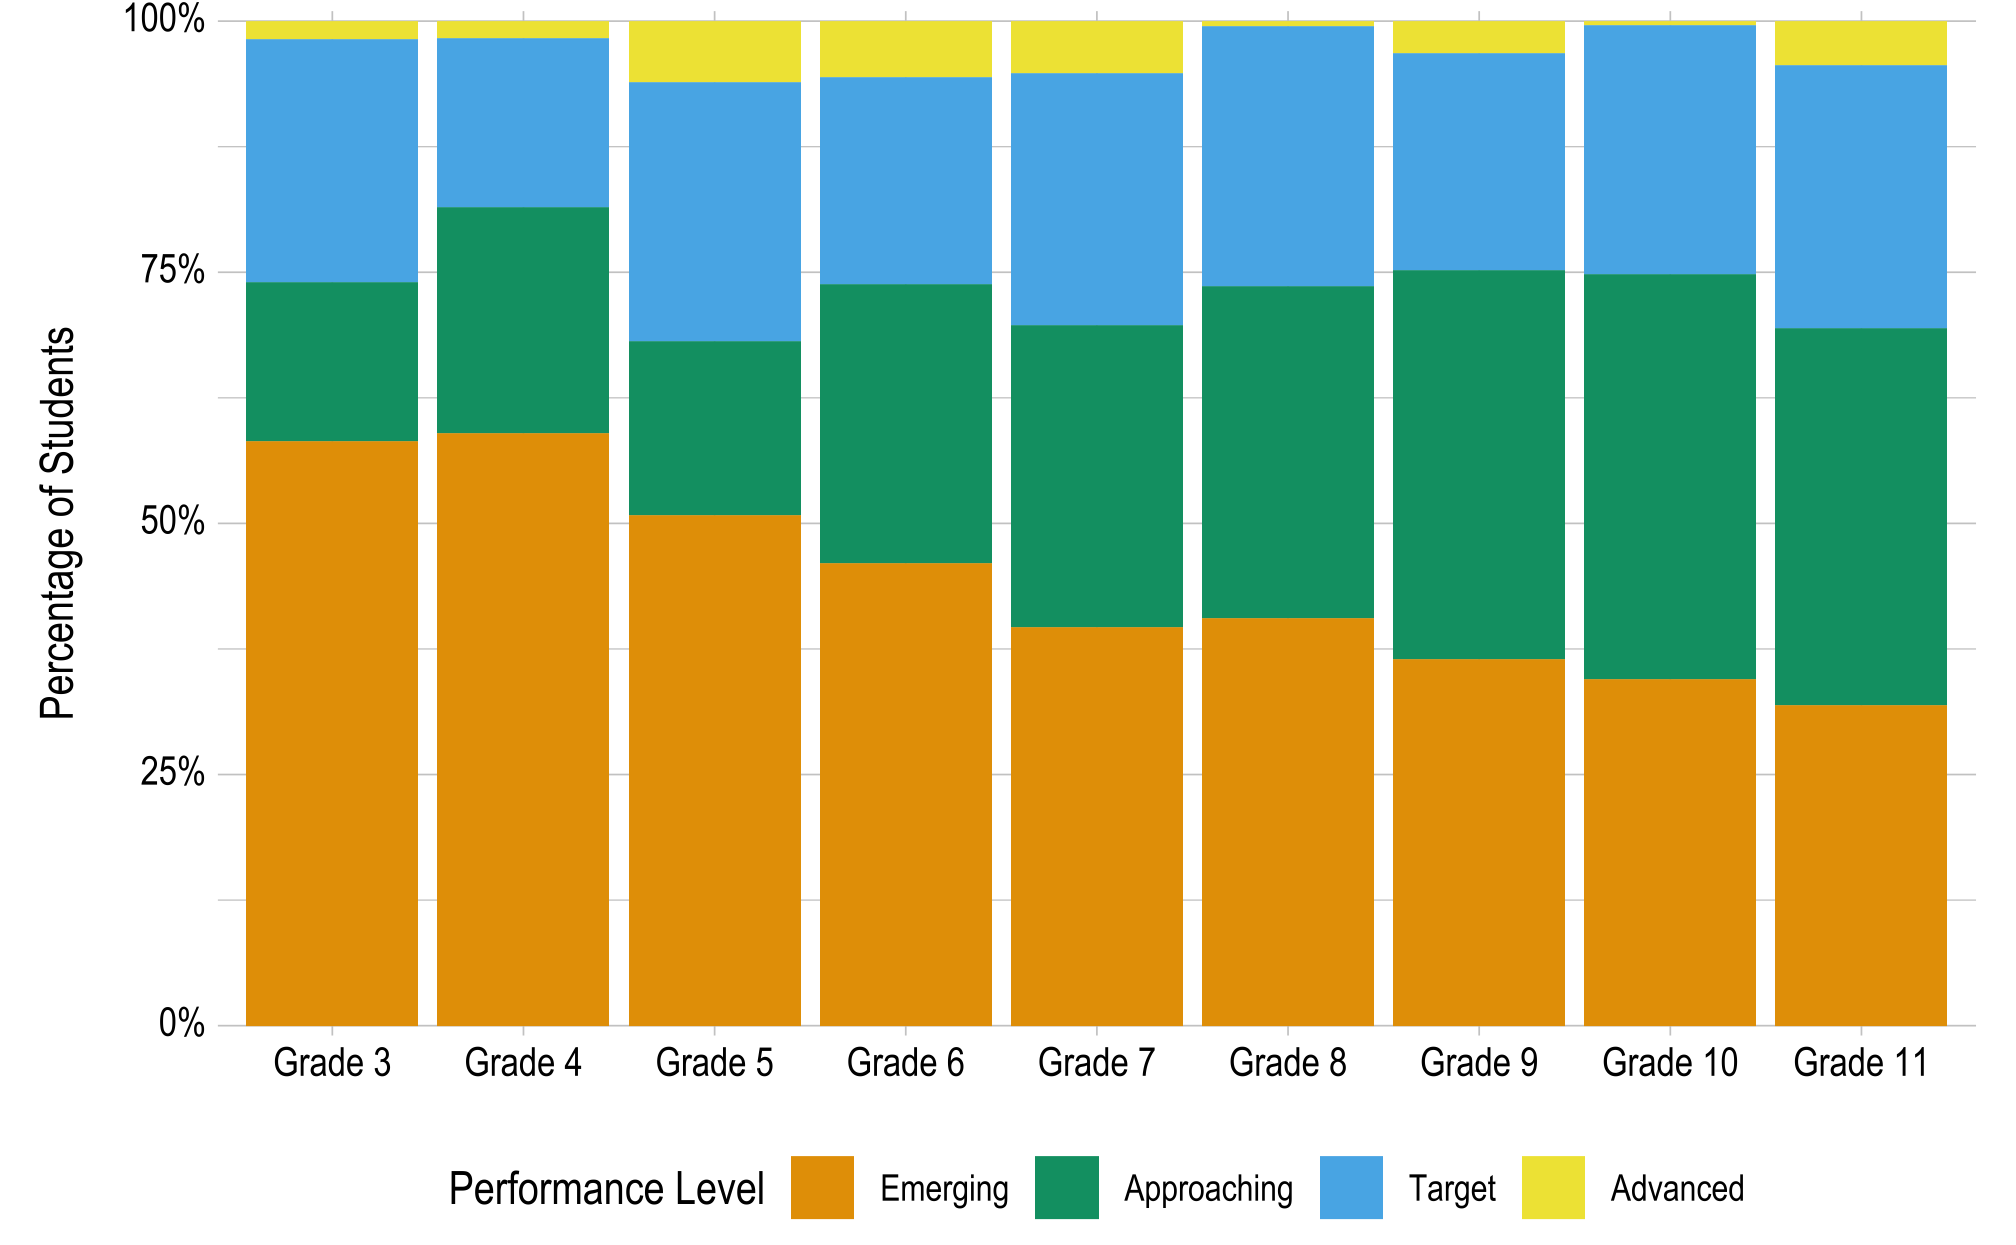
Figure 6.6: Mathematics Impact Data Using Adjusted Cut Points
| Subgroup | n | % |
|---|---|---|
| Gender | ||
| Male | 44,029 | 67.4 |
| Female | 21,201 | 32.5 |
| Nonbinary/undesignated | 64 | 0.1 |
| Race | ||
| White | 37,104 | 56.8 |
| African American | 12,958 | 19.8 |
| Two or more races | 9,399 | 14.4 |
| Asian | 3,569 | 5.5 |
| American Indian | 1,799 | 2.8 |
| Native Hawaiian or Pacific Islander | 301 | 0.5 |
| Alaska Native | 164 | 0.3 |
| Hispanic ethnicity | ||
| Non-Hispanic | 49,246 | 75.4 |
| Hispanic | 16,048 | 24.6 |
| English learning (EL) participation | ||
| Not EL eligible or monitored | 61,440 | 94.1 |
| EL eligible or monitored | 3,854 | 5.9 |
| English language arts complexity band | ||
| Foundational | 7,934 | 12.2 |
| Band 1 | 23,354 | 35.8 |
| Band 2 | 23,620 | 36.2 |
| Band 3 | 7,287 | 11.2 |
| Missing* | 3,099 | 4.7 |
| Mathematics complexity band | ||
| Foundational | 8,328 | 12.8 |
| Band 1 | 23,446 | 35.9 |
| Band 2 | 26,103 | 40.0 |
| Band 3 | 6,221 | 9.5 |
| Missing* | 1,196 | 1.8 |
| * Students with missing complexity band information only completed assignments in one subject by May 6, 2022 (i.e., students with a missing English language arts complexity band only completed their mathematics assessment). | ||
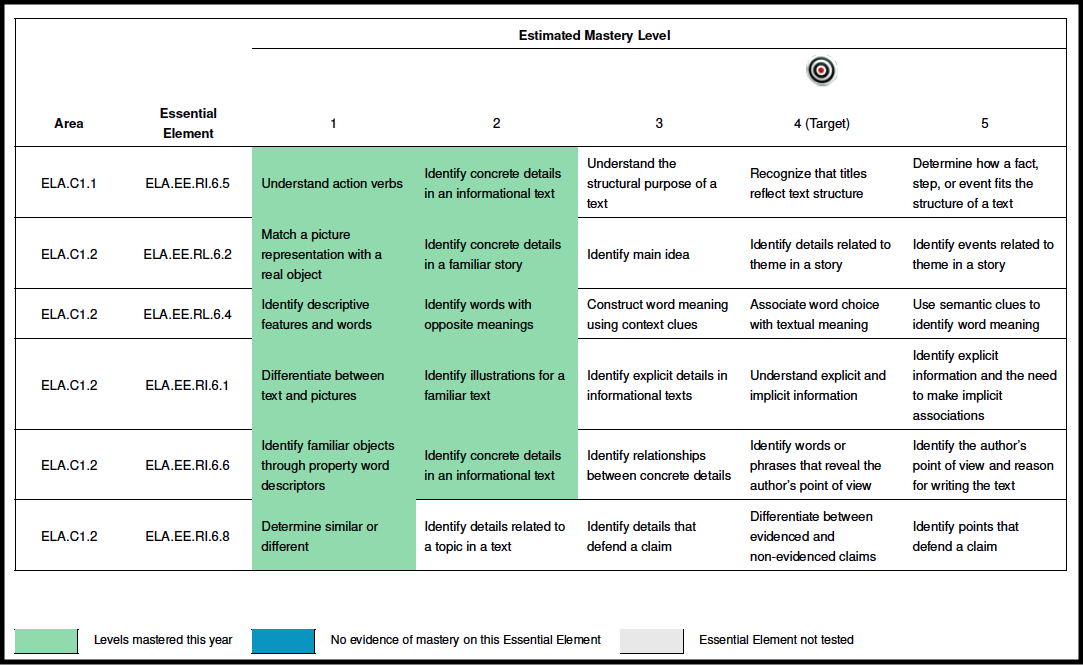
6.2.3.3 Mastery Profile Development
To preserve the original content-based standard setting method and to aid in the evaluation of adjusted cut points, example mastery profiles were created for each of the cut points in Table 6.11. Because the original standard setting method and the adjustment process were based on mastery profiles, there were many different ways a student could master a specified number of linkage levels in a subject. DLM staff identified the most common profiles using data from spring 2018, spring 2019, and spring 2021. When evaluating data from 2018 and 2019, before the blueprint revisions were implemented, DLM staff included only results from EEs retained in the blueprint revision when calculating the total linkage levels mastered and building the mastery profiles. After building the profiles for each year, DLM staff combined the data and identified the three most common mastery profiles across years for the total linkage levels mastered at each cut point. DLM staff then generated a visual representation of each selected profile for each of the adjusted cut point values (see Figure 6.7).
Figure 6.7: Example Mastery Profile for a Hypothetical Student
6.2.4 External Evaluation of Standards Adjustment Process and Results
The TAC provided feedback throughout 2019, 2020, 2021, and 2022 on the methodology, procedures, and results of the standards adjustment process. The adjusted cut points were presented to the TAC on May 11, 2022, along with an evaluation of the impact data and a comparison of the impact data to the reported impact data from spring 2019. Following this presentation, the TAC prepared and accepted a resolution endorsing the adequacy, quality of judgments, and extent to which the process met professional standards and recommended the adoption of the adjusted cut points. The complete TAC recommendation can be found in Appendix D.1.
Following the May 11, 2022, meeting of the TAC, a set of materials was provided to the DLM Governance Board for review. Materials included the adjusted cut points, the set of example mastery profiles previously described, a summary of the adjustment methodology, and the TAC resolution. Following the distribution of materials on May 11, 2022, state education staff conducted their own internal reviews of the adjusted cut points and example mastery profiles. This review varied by state, but included the opportunity for states to collect additional feedback from subject matter experts in their department, educators, and other stakeholders. Additionally, a governance board check-in call was hosted on May 17, 2022, for state education agency staff to ask questions about the adjustment process and results. Discussion during this call primarily focused on the representativeness of the May 6 sample and the implementation of the ±2 adjustment to match the 2019 impact data.
Following the check-in call and states’ internal review of materials, the governance board conducted a vote on the adjusted cut points on May 24, 2022. Of the 14 states participating in the Year-End model, 4 were absent during the voting, resulting in 10 voting members who were present. The voting process consisted of three rounds of voting. In the first round of voting, the governance board had the option to proceed or delay the final vote to allow for more time to review the standards adjustment materials. All participating states (n = 10) voted to proceed with the final vote. In the second round of voting, governance board members had a nonbinding vote to adopt the adjusted cut points. In this vote, two states abstained, and all other participating states (n = 8) voted to adopt the adjusted cut points. Following the second round, governance board members had a final opportunity for discussion and to recommend any changes to the proposed cut points. No recommendations were made, so the governance board proceeded to the third and final round of voting, which was to officially adopt the adjusted cut points. In this vote, three states abstained and the remaining states (n = 7) voted unanimously to adopt the adjusted cut points as the final consortium cut points with no further adjustment.
6.2.5 Post-Hoc Analysis
Following the close of the 2022 spring assessment window on June 10, 2022, DLM staff conducted post-hoc analyses to verify the adjustments made using the sample of students who completed their assessment by May 6, 2022. DLM staff first compared the May 6 sample used for the adjustment to the full sample of students who completed DLM assessments in spring 2022 to verify that the May 6 sample was representative of the DLM student population as the initial analyses indicated. DLM staff then conducted the same ±2 adjustment to compare the cut points that were achieved from the May 6 sample to those that would have been achieved if the full sample were utilized.
Table 6.13 shows the number of students who completed their assessment by May 6 (from Table 6.8 above) and the number of students who completed their assessment during the entire 2022 spring assessment window. Across all grades and subjects, the May 6 sample represented 75% of all completed assessments, ranging from 72% in Grade 7 ELA to 96% in Grade 10 mathematics. Thus, the May 6 sample represented an even larger percentage of the full sample than the 70% that was initially estimated.
| Grade | Completed by May 6 | Total completions | % of total |
|---|---|---|---|
| English language arts | |||
| 3 | 7,754 | 10,712 | 72.4 |
| 4 | 8,070 | 11,051 | 73.0 |
| 5 | 8,103 | 11,090 | 73.1 |
| 6 | 8,169 | 11,279 | 72.4 |
| 7 | 8,341 | 11,640 | 71.7 |
| 8 | 8,535 | 11,694 | 73.0 |
| 9 | 4,081 | 5,630 | 72.5 |
| 10 | 2,613 | 2,729 | 95.7 |
| 11 | 6,529 | 8,296 | 78.7 |
| Mathematics | |||
| 3 | 7,757 | 10,684 | 72.6 |
| 4 | 8,082 | 11,027 | 73.3 |
| 5 | 8,165 | 11,080 | 73.7 |
| 6 | 8,639 | 11,327 | 76.3 |
| 7 | 8,796 | 11,711 | 75.1 |
| 8 | 8,702 | 11,713 | 74.3 |
| 9 | 4,303 | 5,676 | 75.8 |
| 10 | 2,646 | 2,744 | 96.4 |
| 11 | 7,008 | 8,399 | 83.4 |
DLM staff then compared the demographic distribution of the May 6 sample to the full sample from the complete spring assessment window. As in the initial analyses, DLM staff calculated Cramér’s V effect sizes for the differences in each subgroup between samples. Table 6.14 shows the effect sizes when comparing the May 6 sample to the sample of all students who completed DLM assessments in spring 2022. As indicated in the initial analyses, the May 6 sample was highly consistent with the full sample. All effect sizes were in the negligible range, and the largest effect size was only .079. Thus, the evidence from the full spring assessment window supports the claim that the May 6 sample was representative of the full DLM student population in 2022.
| Grade | Gender | Race | Hispanic ethnicity | English language learner status | Complexity band |
|---|---|---|---|---|---|
| English language arts | |||||
| 3 | .007 | .023 | .005 | .027 | .012 |
| 4 | .010 | .027 | .010 | .045 | .013 |
| 5 | .008 | .030 | .005 | .034 | .013 |
| 6 | .006 | .024 | .013 | .033 | .018 |
| 7 | .009 | .027 | .010 | .042 | .019 |
| 8 | .006 | .024 | .013 | .040 | .013 |
| 9 | .011 | .036 | .020 | .079 | .023 |
| 10 | .003 | .009 | .003 | .002 | .004 |
| 11 | .009 | .019 | .014 | .002 | .011 |
| Mathematics | |||||
| 3 | .007 | .024 | .002 | .027 | .029 |
| 4 | .008 | .026 | .010 | .048 | .021 |
| 5 | .004 | .029 | .004 | .034 | .021 |
| 6 | .005 | .021 | .010 | .029 | .020 |
| 7 | .008 | .022 | .013 | .042 | .013 |
| 8 | .006 | .021 | .016 | .038 | .022 |
| 9 | .013 | .031 | .007 | .079 | .017 |
| 10 | .004 | .007 | .001 | .001 | .003 |
| 11 | .004 | .015 | .013 | .002 | .014 |
6.2.5.1 Cut Point Comparison
Following the close of the spring assessment window, DLM staff conducted the same ±2 adjustment process that was enacted with the May 6 sample to investigate whether the use of the May 6 sample resulted in different cut points than would have been achieved with the full DLM student population. When using the data from the full spring assessment window, the adjustment process resulted in the same cut points that were achieved with the May 6 sample (see Table 6.11). Thus, the limited nature of the May 6 sample had no effect on the adjustment process, as the cut points achieved with the May 6 sample are identical to what would have been achieved with the full set of student data. Thus, in totality, the post-hoc analyses support the process and use of the May 6 sample to conduct the final step of the standards adjustment process.
6.2.6 Updated Grade and Subject Performance Level Descriptors
Following the cut point adjustments, the test development team updated the grade and subject PLDs so that they matched the revised blueprint and reflected the new cut points.
The process was conducted in two phases. Phase 1 analyzed the original grade- and subject-specific PLDs against the revised blueprint to bring the PLDs into alignment with the content in the revised blueprint. Specifically, statements related to content for EEs that were not retained on the blueprint, and therefore were no longer relevant, were removed. In Phase 2, the adjusted cut points and example mastery profiles were used to verify the content of the updated PLDs. Test development specialists analyzed the example mastery profiles around the cut scores for each grade, subject, and performance level. When necessary, statements were moved into the skill ranges reflected in the example profiles. The newly revised PLDs include the knowledge, skills, and understandings that students typically demonstrate at performance levels defined by the adjusted cut points.
The revised PLDs were reviewed internally for content accuracy and were shared with the DLM Governance Board on June 14, 2022. Appendix D.2 contains examples of grade level and content PLDs, and all PLDs for ELA and mathematics are available on the DLM website.
6.3 Conclusion
In summary, the performance levels for DLM assessments are determined by applying cut points to the total number of linkage levels mastered within each subject. The cut points were originally developed by experienced panelists evaluating mastery profiles that summarize the skills and understandings that a student mastered in each subject. Thus, the resulting performance levels are based on the most common profiles of skill mastery that align to the policy PLDs adopted by the DLM Governance Board in 2015. In 2022, the cut points were adjusted to reflect the revised assessment blueprints. This adjustment process resulted in cut points that accounted for the reduced number of EEs on the blueprint, while recognizing that the overall construct was stable. Finally, grade- and subject-specific PLDs that describe the skills most commonly mastered by students who achieve at each performance level were developed based on the content of the EEs and the cut points derived from the standard setting and adjustment process.